Get a free book sample
Fill in your information and the book will be sent to your email in no time
Whether you are a student of nursing, health sciences, public health, or another specialty, you may be interested in expanding your knowledge of epidemiology. Today, the study of infectious diseases is not limited to specialists in the field or researchers. In our ever-shrinking world, an emerging disease can turn from a small outbreak in one country to a global pandemic in a few weeks. Additionally, shrinking forests and greater urbanization increase the risk of zoonotic transmission of pathogens (transfer of an infectious virus or bacteria to humans from animals).
Understanding the spread of diseases and epidemiological data can help clinicians and nurses detect and curtail infections early. Public health and government agencies prevent the spread of emerging infectious diseases on their shores. Here are the most common epidemiological metrics to help you get started, in a handy epidemiologic glossary.
Incidence refers to the probability of a disease occurring in a given population in a specific time period. The incidence measures new cases that develop or are diagnosed in a month or a year. For example, if there are 100 new cases of plague within a city of 1,000 people in one year, the incidence rate would be 10%. Likewise, if there are 80 new cases of plague in a city of 1 million people in a year, the incidence rate would be 8 per 100,000 people. Both methods of representation of incidence rate are accepted as they are both numerical statistical measures that are clearly recognized by the epidemiology and public health industries.
We can see this visually represented with outbreak or case maps. We can compare the two GIDEON maps below that are color-coded based on incidence. The first map is an outbreak map for the plague and the second is that for SARS-COV-2 or COVID-19. Between the two, even at first glance, we can identify the higher incidence of COVID-19 versus the current endemicity of the Plague.
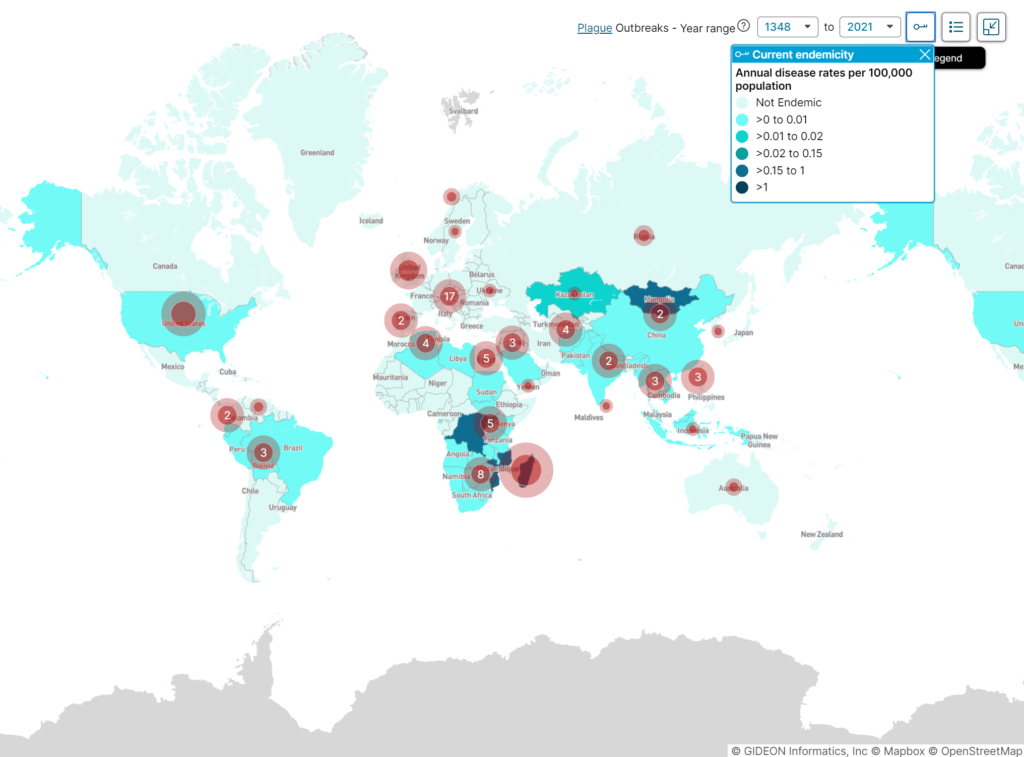
Plague global outbreaks map, years 1348 to 2021.
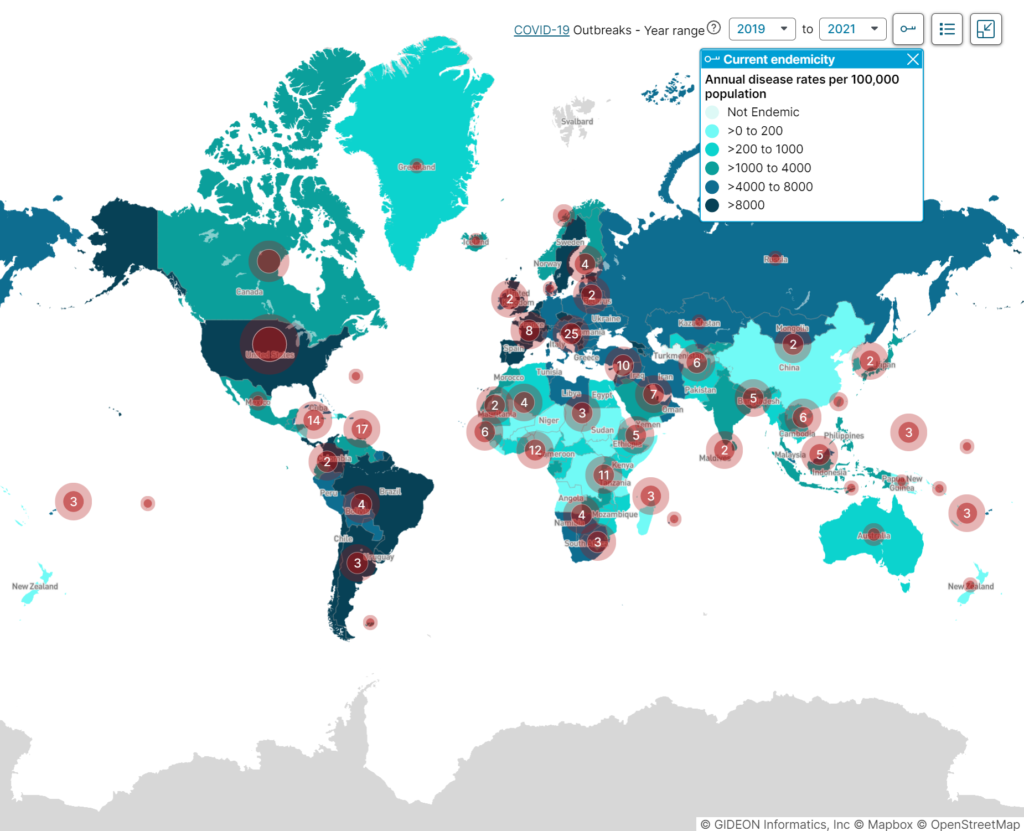
COVID-19 global outbreaks map, illustrating disease incidence between the years 2019 to 2021
This information is important to epidemiologists because it helps them to understand how diseases spread and identify possible interventions to stop the spread of disease. If the incidence rate of the plague is increasing, epidemiologists may recommend measures such as quarantining infected individuals or spraying public areas with insecticide to prevent further spread. By tracking incidence rates, epidemiologists can play an important role in protecting populations from potentially deadly diseases. Data like incidence rates, especially when displayed visually like in GIDEON can be used to form an operational research hypothesis and lead to the start of in-depth studies.
Prevalence is the share of a population affected by a given condition at a specific point in time. It can be assessed for various conditions, including diseases, risk factors, and health behaviors. Unlike incidence, which measures how many people develop a condition over a specific period of time, prevalence captures the total number of cases at a given point. It is typically expressed as a percentage or as the number of cases per 100,000 people.
Prevalence is important for public health surveillance and epidemiology because it provides information on the overall burden of disease in a population. This can help inform allocation of resources and target interventions to reduce the disease burden. Prevalence data can also be used to monitor trends over time to assess whether interventions are having an impact.
There are two main types of prevalence:
The prevalence of chickenpox in Europe can be used by epidemiologists to combat the disease. For example, epidemiologists can study the prevalence of chickenpox in different countries and regions to identify areas where the disease is more common. This information can then be used to develop strategies to reduce the prevalence of chickenpox in those areas. The difference between point prevalence and period prevalence is important to know because it can help epidemiologists to understand how the prevalence of disease changes over time.
Chickenpox is an example of a disease with a high point prevalence but a low period prevalence. Since the point prevalence of chickenpox is high, but the period prevalence is low, this may indicate that the disease is spreading rapidly. We also know that most people who get chickenpox will recover from the disease within a few weeks while some people will develop complications from chickenpox and will remain affected by the disease for longer periods of time.
If both measures are high, this may indicate that the disease is endemic (constantly present) in the population. Chickenpox is a highly contagious disease, so it is important for epidemiologists to track its prevalence to combat its spread.
Prevalence and incidence data are two of the most important tools used by epidemiologists to track the spread of disease. We know that prevalence is a measure of how many people are currently infected with a disease, while incidence is a measure of how many new cases of disease there are in a population over time. Both prevalence and incidence data are essential for understanding the spread of disease and developing an effective response.
Let’s look at infections from COVID-19 (SARS-COV-2) as an example. In December 2019, when the first outbreak happened, incidence and prevalence numbers worldwide were low. By March 2020, incidence numbers (newly diagnosed cases) were high. Global prevalence numbers were still low because the virus hadn’t spread to the larger population. But by July 2021, worldwide incidence and prevalence numbers were high due to highly infectious variants.
The high incidence of COVID in the early months of the pandemic indicated that the disease was spreading rapidly and that immediate action was needed. The prevalence data showed that the disease was still active in many parts of the world, even as some countries began to see a decline in new cases.
During the COVID pandemic, we saw these metrics used in practice all over the world. Specifically, prevalence data was used by global health experts and epidemiologists to track the overall number of cases and understand how the disease was spreading. This information was essential for epidemiologists in developing disease control measures such as travel restrictions and quarantines. Incidence data were also used to track the number of new cases and identify hot spots where the disease was spreading rapidly. This information was critical for identifying areas that needed targeted interventions.
Overall, prevalence and incidence data played a vital role in guiding the response to the COVID pandemic. By understanding how the disease was spreading, epidemiologists were able to develop more effective control measures and target interventions to areas where they were needed most.
Seroprevalence refers to the number of people in a population who test positive antibodies to a pathogen (infectious virus or bacteria). Seroprevalence to an antibody to a virus or pathogen can give us an idea of the number of people infected. Seroprevalence is expressed as the percentage of people with antibodies to an infectious agent. For example, if 10% of people have been infected with a certain virus, then the seroprevalence for that virus would be 10%.
It is used to track the spread of infection and can be helpful for public health officials in determining which populations are most at risk for certain diseases. In a medical laboratory, seroprevalence testing is done by taking a blood sample from a person and then testing it for the presence of antibodies. Antibodies are proteins that the body produces in response to an infection. This is also known as serologic testing of a sample, it specifically measures the level of antibodies against a pathogen in serum (the clear fluid portion of blood). This type of sample testing is often used to screen blood donations for infectious agents.
One of the key advantages of seroprevalence testing is that it can help to identify asymptomatic individuals who may have unknowingly spread the disease. This information is critical for developing an effective disease response and ensuring that adequate resources are allocated to containment efforts. Additionally, by tracking changes in prevalence over time, these tests can also provide valuable insights into the efficacy of containment measures. This information helps public health professionals to plan disease control measures and to evaluate the effectiveness of disease response strategies.
It’s especially helpful to combine prevalence data with seroprevalence data since they both give a better view of the whole picture of a condition or disease. Prevalence of a disease can be affected by many factors, including the age of the population, the incidence of the disease, and the number of people who have died from the disease while the seroprevalence of a disease can be affected by the same factors, but it can also be affected by how long ago people were exposed to the disease.
A seroprevalence survey involves blood serum testing of a population and monitoring whether a particular substance is present or absent in the sample. This type of study is helpful in determining the health of the population. It is a type of epidemiological study that looks at the prevalence of antibodies to a particular disease in a population. Blood samples are collected from individuals and then tested in a laboratory for the presence of antibodies. The data can be used to estimate the prevalence of infection with a given pathogen and assess the effectiveness of vaccination programs. This can be invaluable when creating a hypothesis, conducting exposure research, or other statistical analysis based on population health.
These seroprevalence surveys can be tailored based on how widespread or localized the infection is. These studies and their data help epidemiology officials understand how an infectious agent or pathogen spreads across a specific population over a period.
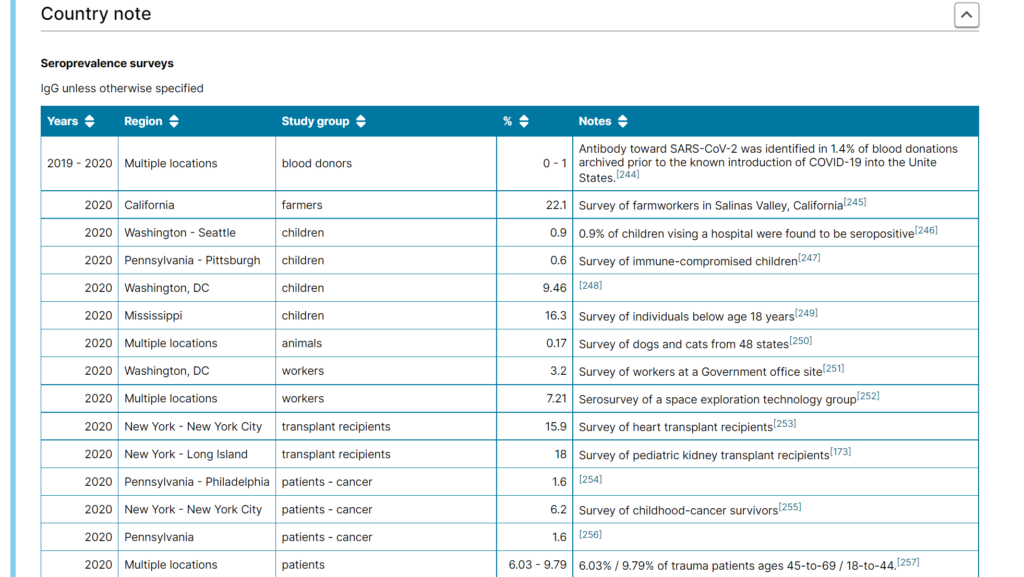
COVID-19 United States Seroprevalence studies list screenshot, Country Note from GIDEON database.
Simply put, morbidity means disease therefore the morbidity rate measures how often a specific disease or illness occurs in a given population and includes acute and chronic conditions. More specifically, a morbidity rate measures the prevalence of a particular medical condition in a population. It is typically expressed as the number of cases of the disease per 100,000 people. It’s important to note that morbidity is different from mortality, which refers to the number of deaths in a population. The metric is used by public health officials, governments, healthcare systems, epidemiologists, and many more to estimate the overall health of a given population.
There are lots of different ways to measure morbidity, but one of the most common is through something called the Disability-Adjusted Life Year (DALY) score. This score considers both the length and quality of life lost due to premature death or illness. Ultimately, the goal is to develop a single number that gives us a good sense of overall population health.
The morbidity rate is expressed as a percentage of the number of cases of a specific disease or condition in a given population. The statistical value of a morbidity rate depends on how it is calculated. For example, if only people who seek medical treatment for their condition are included in the numerator (the top number), then the resulting rate will be lower than if all cases of the infection are included. A higher morbidity proportion indicates a greater number of people suffering from illnesses or diseases.
Anthrax morbidity rates in the United States have varied widely over time, with a few hundred cases reported each year in the early 1900s, then declining to just a handful of cases per year by the late 1940s. However, there was a resurgence of anthrax cases in the 1970s, with an average of 55 cases per year being reported during that decade. Cases then declined again in the 1980s and early 1990s but rose to an average of 30 cases per year from 2001 to 2008.
The increase in morbidity rates in the United States since 2001 can largely be attributed to bioterrorism-related Anthrax scares. In 2001, there were 22 confirmed cases of anthrax, and the morbidity rate was 7 per 100,000 people. This was the highest morbidity rate since 1987 when there were 3 confirmed cases of anthrax, and the morbidity rate was 0.1 per 100,000 people. This led to widespread panic and increased vigilance for Anthrax cases, which likely reported more cases.
In 2013, there was 1 confirmed case of anthrax, and the morbidity rate was 0.3 per 100,000 people. Although the number of cases has decreased, the morbidity rate remains higher than it was prior to 2001. However, it is essential to note that the morbidity rate (cases per 100,000 population) has remained relatively stable over time, hovering around 1 case per million people since the early 1990s.
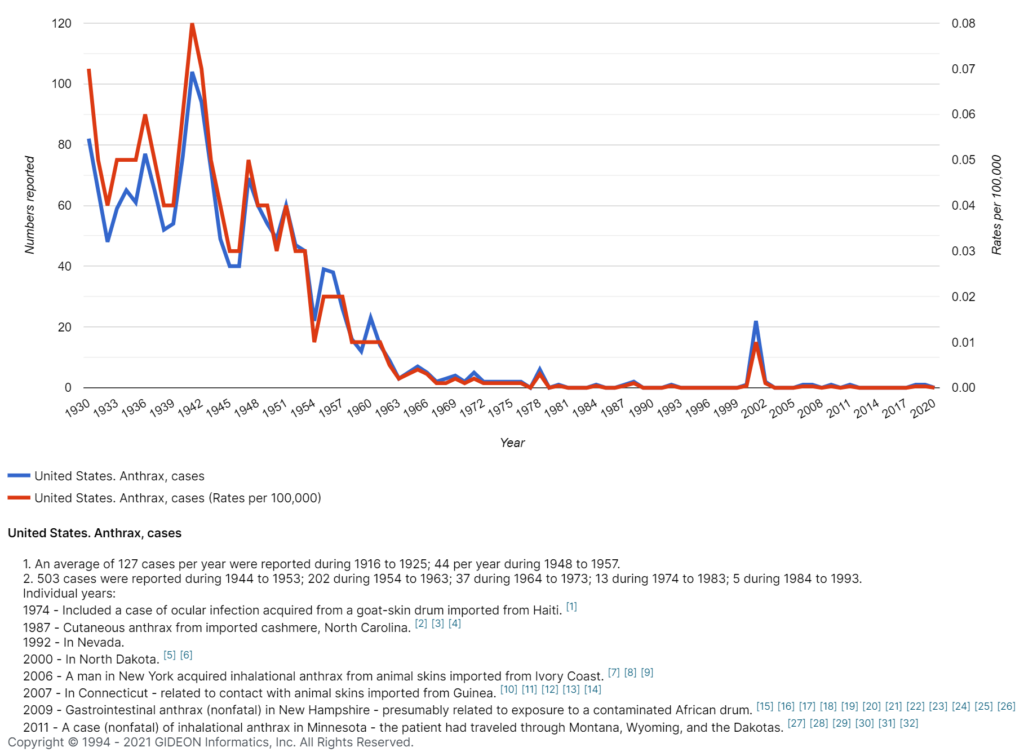
Anthrax (Bacillus anthracis) annual cases in the United States, 1930 – 2020.
The history of incidence proportions dates back to the early days of epidemiology when British physician John Snow first used them to track the spread of cholera in London in 1854. Snow noticed that the incidence of cholera was higher in certain neighborhoods, and he believed that this was due to contaminated water sources. By mapping the incidence of cholera, Snow was able to identify the tainted water pump and persuades authorities to disable it, effectively halting the outbreak. Since then, incidence proportions have been used to track a variety of infectious diseases, including polio, AIDS, and tuberculosis. Today, they remain an essential tool in the fight against infectious diseases.
The term “attack rate” is used in public health to refer to the incidence proportion of the number of new disease cases divided by the number of people at risk for the disease. Since it measures the proportion of people who develop a specific condition or illness in a population initially free from that disease or illness, this variable is commonly used in epidemiology to track disease outbreaks. Public health officials use the metric to estimate how many individuals may be infected during an epidemic or pandemic.
Speaking in a numerical sense, the Attack Rate or Incidence Proportion is calculated as the number of new cases of an infection in the total at-risk population and expressed as a percentage. By tracking attack rates, epidemiologists can identify areas where diseases are spreading and take steps to contain the outbreak. In this way, incidence proportions play an important role in protecting public health.
The Secondary Attack Rate estimates the spread of infection from an individual to people in their household, residential area, or another specified group of people at risk of getting infected (like hospital staff). SAR is a critical metric during contact tracing for infectious diseases. The secondary attack rate is expressed as a percentage like the attack rate. It is the number of new cases of an infection developed among a person’s contacts out of their total number of contacts.
The incidence rate measures the number of new disease cases occurring in a given population during a specified timeframe. The incidence rate is often expressed as the number of new cases per 100,000 population. Public health officials use incidence rates to track the spread of infections and to identify populations that are at risk for developing serious illnesses.
For example, the incidence rate of influenza in Asia is currently very high. This means that there is a large number of new cases of the flu occurring in Asia each day. In fact, it’s one of the highest in the world. This is concerning because the flu can be quite dangerous, particularly for young children and the elderly. However, incidence rates can vary depending on the region. For example, the incidence rate of influenza in North America is currently much lower than in Asia. The incidence rate of the flu in Asia has actually been declining in recent years. This is likely due to better hygiene practices and greater awareness of the importance of vaccinating against the flu.
Knowing the incidence rates can help us to slow the spread of the infection by identifying areas where the flu is more likely to occur and by taking steps to prevent its spread to other regions.
The word mortality comes from the Latin word mortalitas, which means “death.” The first recorded use of the term mortality rate was in a 16th-century medical text. The first disease to be discovered to have a mortality rate was cholera. Cholera is a disease that affects the gastrointestinal tract and is caused by contaminated food or water. Yes, that same cholera that was mentioned alongside the father of epidemiology himself, John Snow! The mortality rate for cholera is very high, and it is one of the most deadly diseases in the world.
The mortality rate or death rate helps us understand how frequently death occurs in a given population in a specific amount of time. The metric is expressed as deaths per 1,000 individuals per year or 100,000 individuals per year. The mortality rate for a disease is also expressed as a percentage of the total number of cases.
The disease with the highest mortality rate is HIV/AIDS. As of 2016, the mortality rate for HIV/AIDS was 38%. In contrast, the mortality rate for heart disease was 17%, and the mortality rate for cancer was 23%. However, it is crucial to keep in mind that mortality rates can vary depending on a number of factors, such as the age of the population being studied. Still, these figures give us a general idea of which diseases are most deadly.
Dengue is also a disease of note when assessing mortality rates. Dengue mortality rates vary widely from year to year, and from place to place.
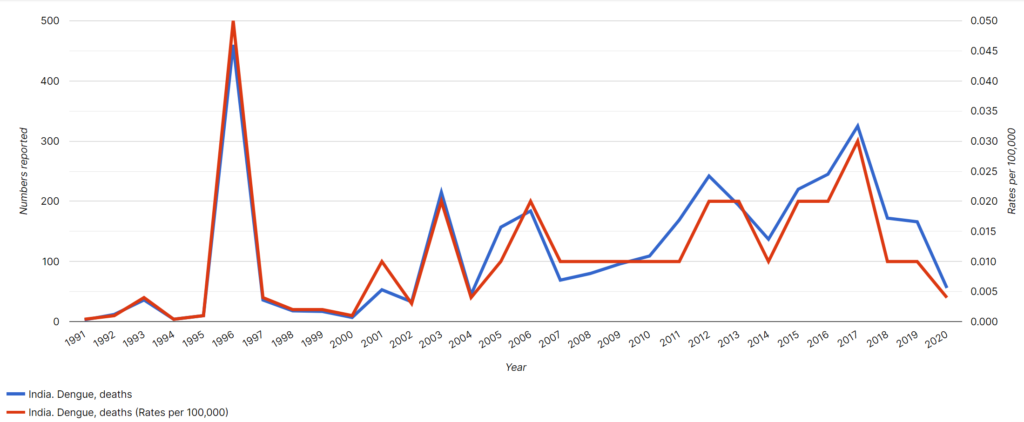
Dengue Mortality Rates for India, 1991 – 2020.
Mortality rates from dengue are quite high in many countries, but they are particularly high in India. In fact, mortality rates from dengue in India are some of the highest in the world. In India, the death rate is at around 1%. This compares to mortality rates of around 0.1% in Vietnam and Thailand and 0.01% in Sri Lanka. Dengue mortality rates in India are more than double the mortality rates from dengue in other countries. The high mortality rate from dengue in India is due to a number of factors, including the large population of people living in close proximity to each other, the lack of access to quality healthcare, and the lack of knowledge about how to prevent and treat the disease.
Epidemiologists can use mortality rates to help combat the disease by understanding where it is most prevalent and by developing strategies to target those areas. mortality rates can also be used to track the progress of efforts to combat the disease. However, mortality rates are not the only important factor when it comes to measuring the impact of a disease. The number of people who contract the disease is also important, as is the number of people who recover from it. In India, around 1 million people are thought to contract dengue fever each year, with around 10% of those developing severe dengue. However, the majority of people recover from the disease without any lasting effects. This means that, while the mortality rate from dengue may be relatively high in India, the overall impact of the disease is relatively low. This is something that epidemiologists will consider when devising strategies to combat dengue fever in India.
Crude mortality rate measures the total number of deaths in a population during a specific period of time. It is called ‘crude’ because the number includes all deaths and provides a high-level estimate of fatalities during a humanitarian crisis. It can be expressed as deaths per 1,000 or 100,000 individuals per year.
The case-fatality rate is used to understand the severity of a disease, evaluate new therapies, and predict how a condition will continue to affect a given population. It estimates the percentage of individuals who die from a specific disease among all people diagnosed with the disease for a given period. It is best applicable for diseases with particular starts and stops, like acute infections or outbreaks. It is not a rate but the proportion of deaths due to a specific disease condition. It is expressed as a percentage. A higher percentage indicates greater disease severity due to more deaths from the disease.
The cause-specific mortality rate is the number of deaths from a particular cause in a population during a given time interval (usually a calendar year). It is expressed as deaths per 100,000 individuals. It is different from the case-fatality rate, which is not precisely a rate but a proportion of deaths in a population from a particular disease.
The age-specific mortality rate gives us the mortality rate for a specific age group of individuals in a given population. It is also often known as the age-adjusted mortality rate. It is the best way to understand diseases highly influenced by age and their impact on a population. This metric is commonly used to understand the rates of heart disease conditions, strokes, diabetes, cancer, and more in a population. Age-specific mortality is expressed as deaths per 100,000 in an age range.
The maternal mortality rate is a ratio that helps us understand how many women die from pregnancy-related complications in a population. It is the number of maternal deaths by the total number of live births in a given period. MMR is expressed as deaths per 100,000 live births. The MMR is a significant health indicator for a country or a given population because most pregnancy-related deaths are preventable. The most considerable pregnancy-related complications include bleeding after childbirth, infections, high blood pressure during pregnancy, and issues that arise during delivery.
While the maternal mortality rate has declined significantly in developed countries over the past few decades, it remains a significant public health problem in many parts of the world. In fact, the maternal mortality rate in developing countries is more than 14 times higher than in developed countries. In developed countries, the maternal mortality rate is lower, but it is still a cause for concern. The main cause of high maternal mortality rates is poor access to quality health care. Other factors that contribute to high rates include poverty, lack of education, and poor nutrition.
Public health interventions that have been shown to be effective in reducing maternal mortality include strengthening the health care system and improving nutrition. Other interventions that effectively reduce maternal mortality rates include improving access to skilled birth attendants and emergency obstetric care, providing antenatal care and postnatal care, and increasing awareness of danger signs during pregnancy. While there is still much work to be done, it is important to continue to invest in public health interventions that can save the lives of mothers around the world.
The infant mortality rate measures the probability of a child born in a specific period dying before it turns one. It helps us understand the likelihood of a newborn infant surviving in a particular population. Since the probability of survival is closely linked to the social structures, economic, and health conditions, it is often a significant indicator of a nation’s health. It is expressed as deaths per 1,000 live births.
In public health and epidemiology, the infant mortality rate is used as a marker of the health of a population and a measure of the effectiveness of health interventions. It is also an important indicator of social and economic conditions. There are many factors that contribute to high infant mortality rates. These include poverty, poor nutrition, lack of access to healthcare, and unsafe delivery conditions. Infectious diseases are also a major cause of death in infants, particularly in developing countries where immunization coverage is low. diarrhea and pneumonia are the leading causes of death in children under five years old, accounting for around 15% of all child deaths globally.
The developed country with the highest infant mortality rate is the United States, with an IMR of 5.8 in 2018. This is near twice the rate in Canada (3.0) and almost three times the rate in Finland (2.3) and Japan (2.1). In 2015, the global infant mortality rate was 31 deaths per 1,000 live births. However, there is significant variation in mortality rates between countries. The five countries with the highest mortality rates are all in Africa:
The five countries with the lowest mortality rates are all in Europe:
Public health interventions such as immunization programs, improved nutrition, and access to clean water and sanitation can help lower infant mortality rates. In developed countries, advances in medical care have also played a role in reducing the IMR.
The term endemic is used to refer to anything that naturally occurs and is confined to a particular location, region, country, or population. An endemic disease is one that is constantly present in a particular population or geographic area. The word endemic can trace its origins back to the Greek word endemos, meaning “inhabited.” Endemic diseases were first classified by Hippocrates, who divided them into two categories: those that were always present in a given location, and those that periodically erupted.
Today, endemic diseases are typically classified as either sylvatic or zoonotic. Sylvatic endemic diseases are primarily found in animals and only occasionally affect humans, while zoonotic endemic diseases can be transmitted between animals and humans. Endemic diseases are typically found in developing countries with poor sanitation and limited access to healthcare.
The first disease to be classified as endemic was malaria, which is endemic to tropical regions of the world. From the malaria outbreak map below, we can see that chloroquine-resistant malarial strains are endemic to specific regions in South Asia, Africa, and South America. Malaria is endemic to over 100 countries, primarily in Africa, Asia, and South America. Today, there are many diseases that are endemic to specific countries or regions. For example, endemic diseases in Britain include brucellosis and vCJD, while in South America, Chagas disease is endemic.
Endemic diseases can pose a major challenge to epidemiologists, who must work to control and prevent the spread of these diseases. In some cases, endemic diseases can be brought under control through vaccination or other public health measures. However, in other cases, endemic diseases may be difficult to control due to a lack of resources or difficulty accessing affected populations.
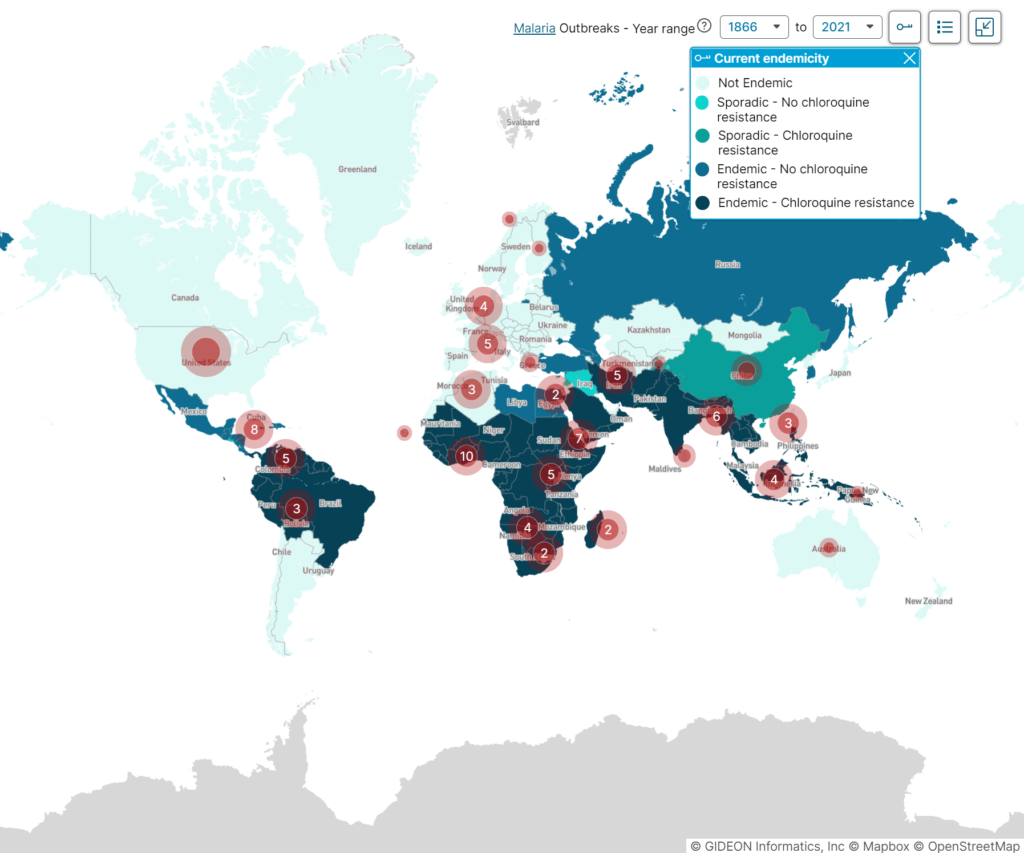
Malaria – current endemicity and historical outbreaks map.
An epidemic affects many people at the same time. In an epidemic, there is a sudden increase in disease infections that spreads in a region or locality where the disease condition is not naturally found. The word epidemic is derived from the Greek epi-, meaning “upon,” “in addition to,” or “in excess of,” and demos, meaning “people.” An epidemic is therefore literally “upon the people.”
The first known usage of “epidemic” in English was in the early 14th century when it was used to describe the constantly recurring waves of disease that swept Europe during the Middle Ages. The first epidemic disease to be classified was the plague, which caused the Justinian Plague. At that time, epidemic simply meant “prevalent among a people or community at a given time.”
In 1847, an epidemic was used to describe a disease that spreads rapidly and simultaneously affects many people. The first disease to be classified as an epidemic in a modern medical sense and in medical texts was cholera.
An epidemic has three main components:
Epidemiologists are health professionals who study the patterns and causes of diseases in order to control their spread. They use this information to develop strategies for prevention and treatment. By understanding the factors that contribute to the spread of epidemic diseases, epidemiologists can help to save lives. There are some other terms in relation to epidemics that are critical to know such as: